Iran National STEPwise approach to chronic disease risk factor surveillance (STEPS) surveys report 2016
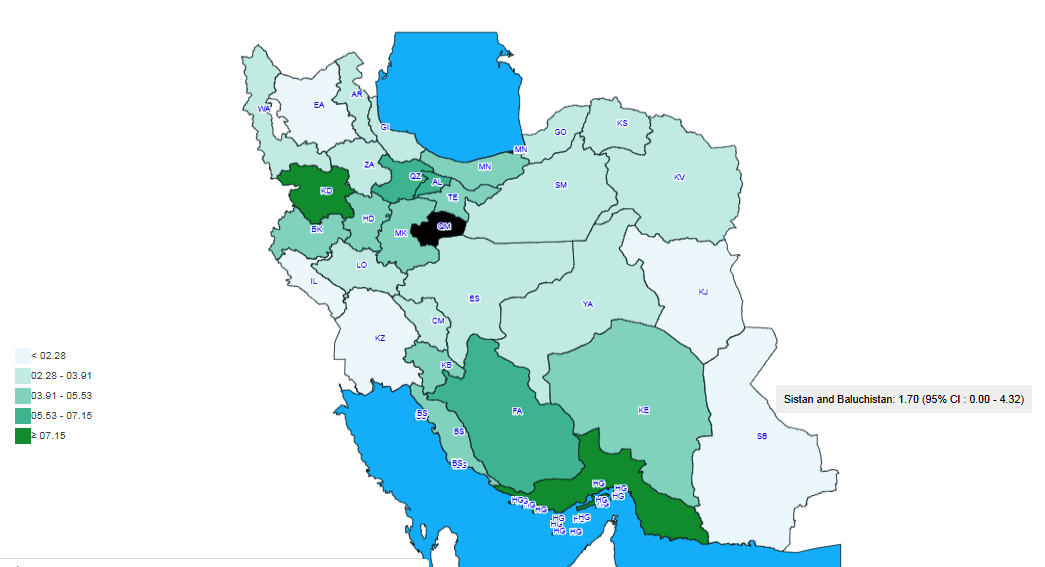
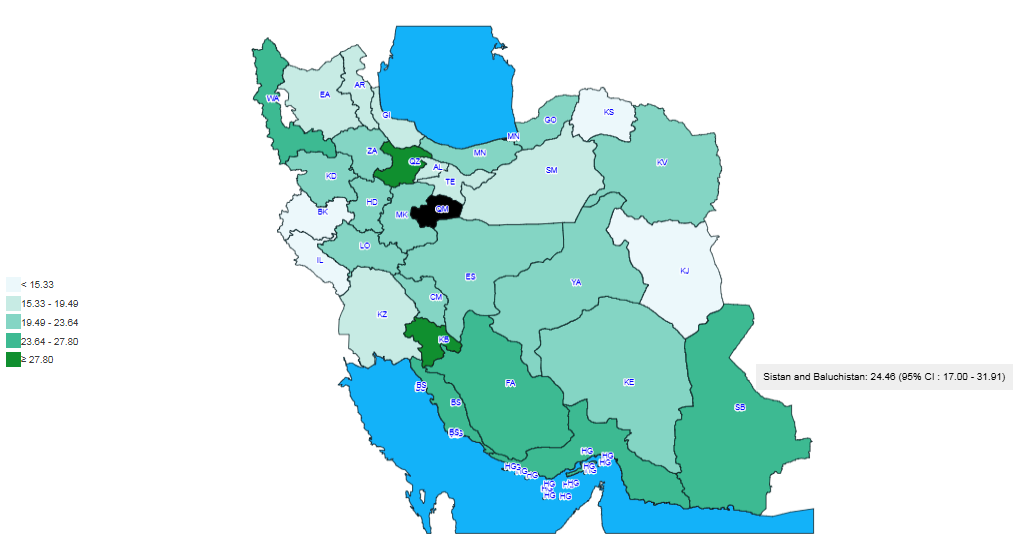
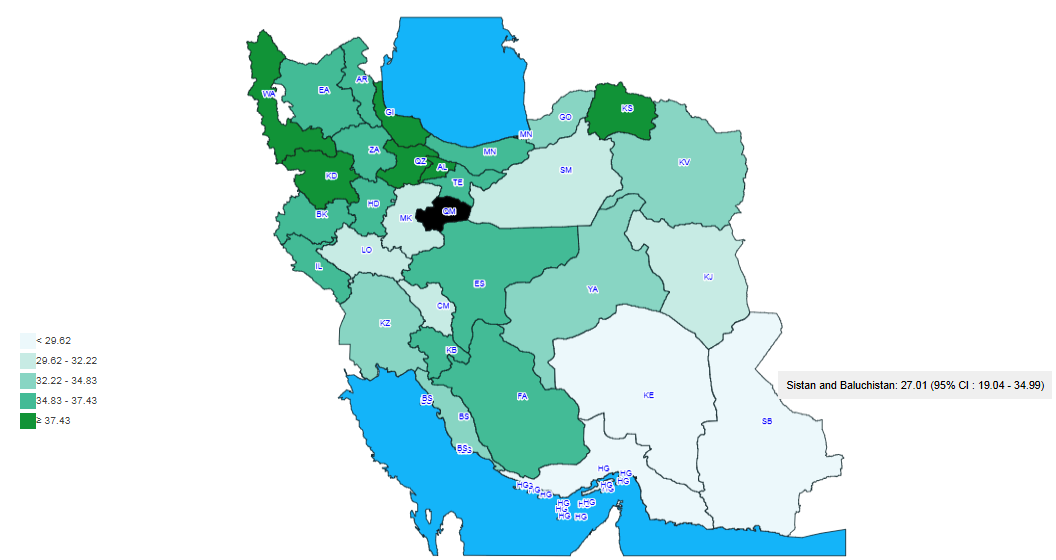
S1-Provincial distribution of appropriate dairy consumption, age-standardized, both sexes, 2016
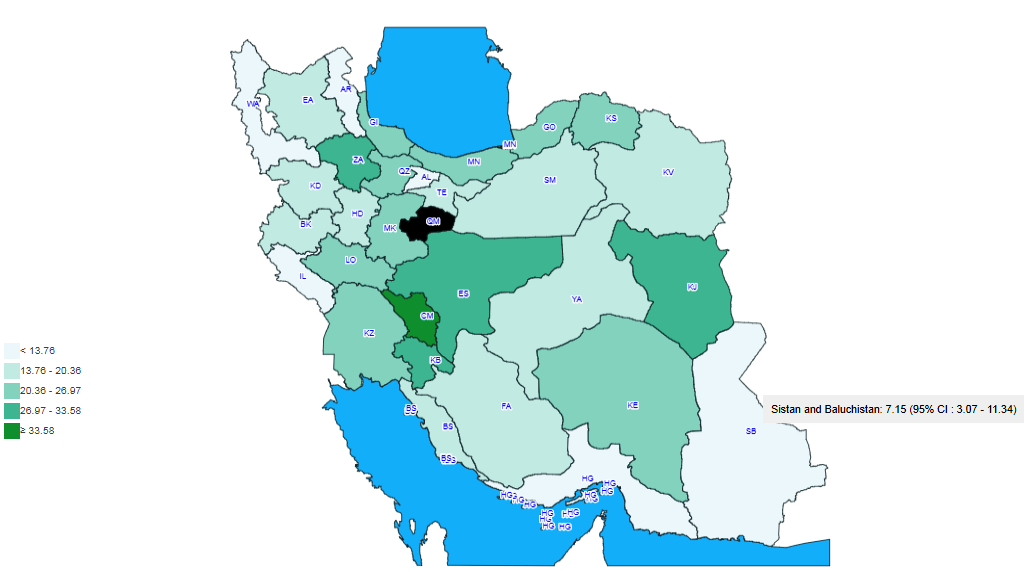
Source: https://vizit.report/en/index.html
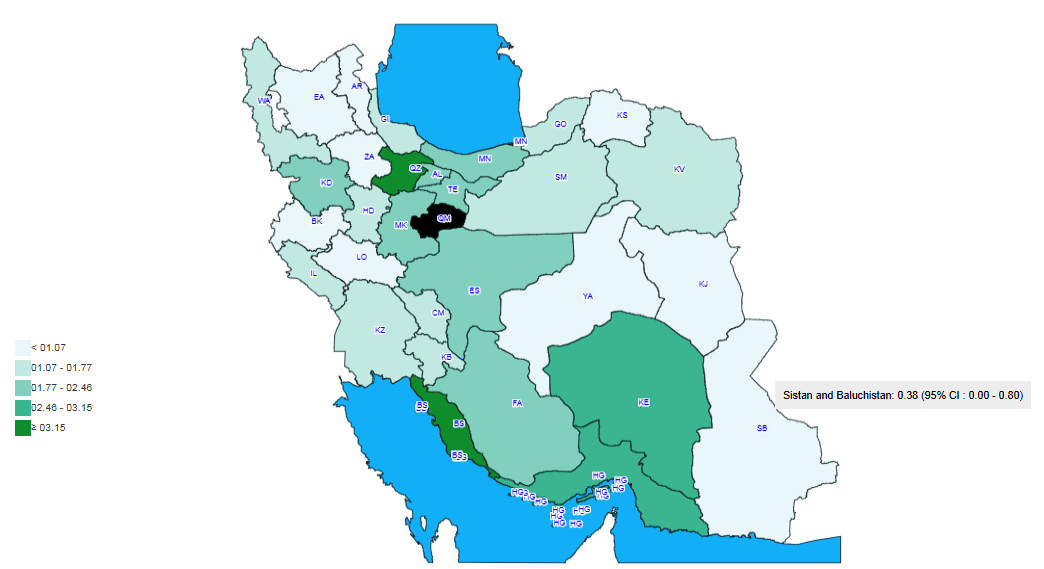
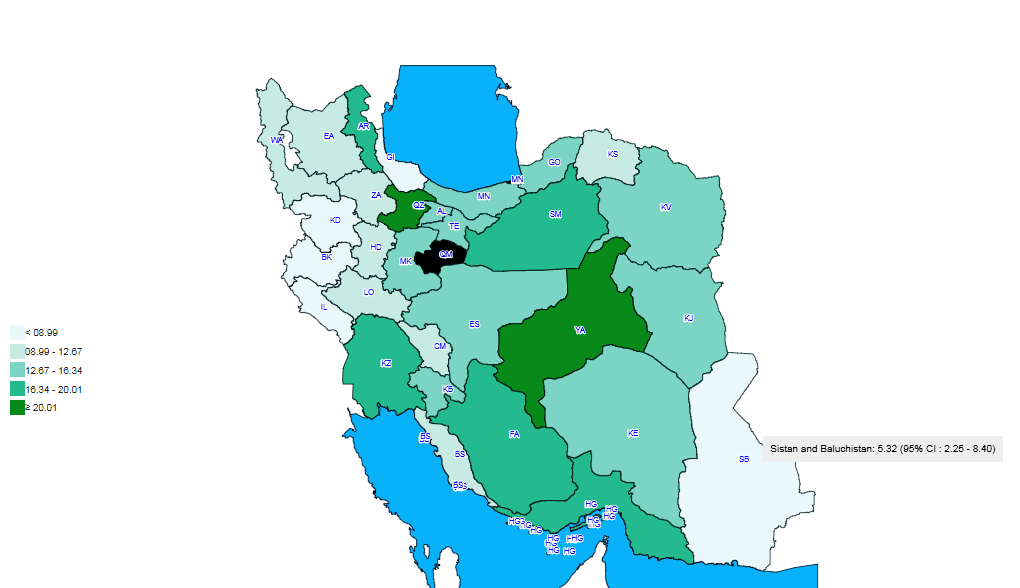
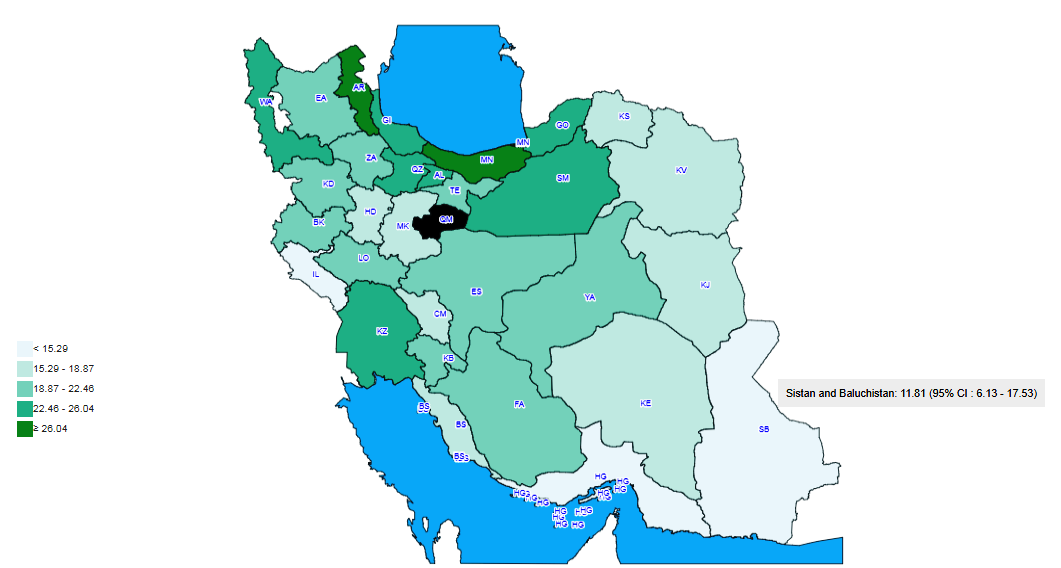
S2-Provincial distribution of appropriate fish serving, age-standardized, both sexes, 2016
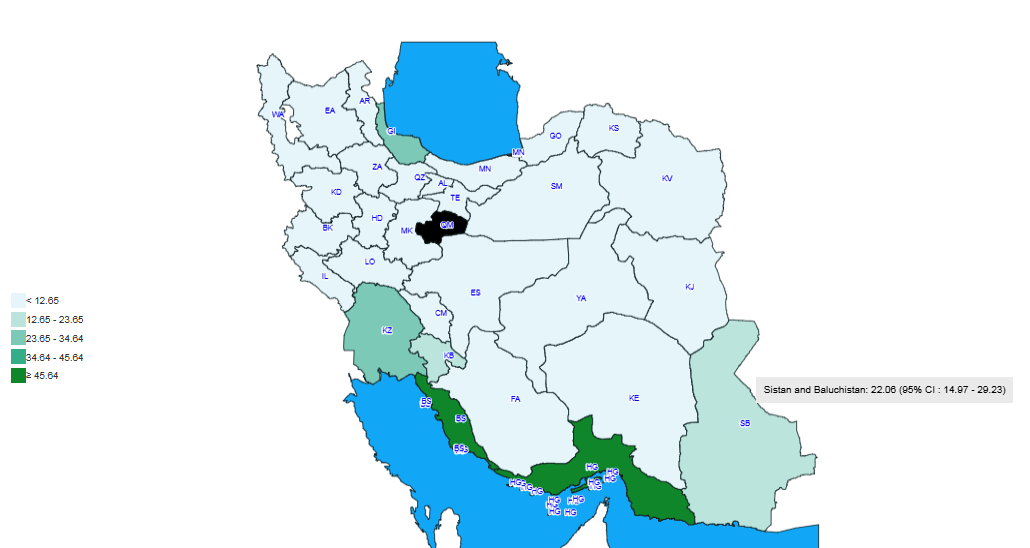
Source: https://vizit.report/en/index.html
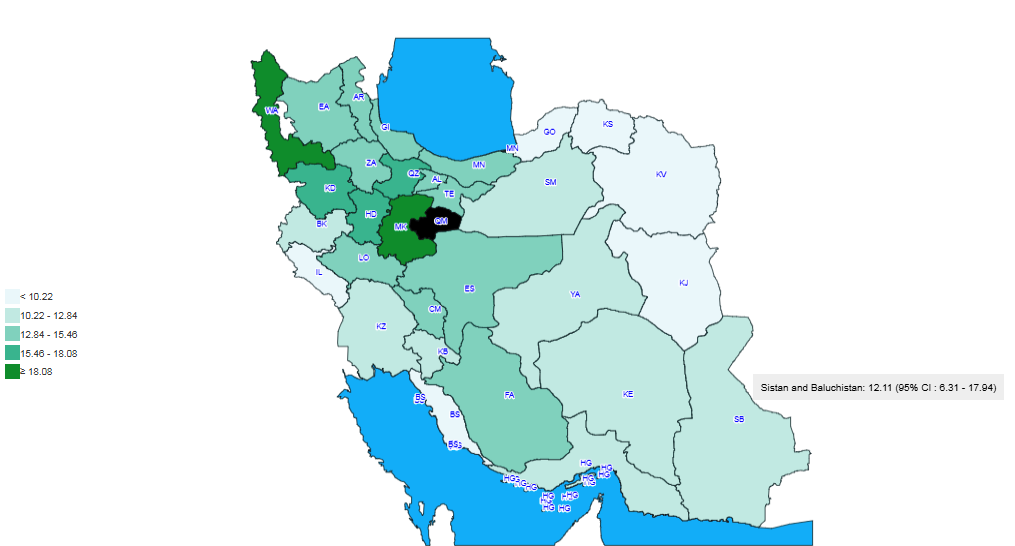
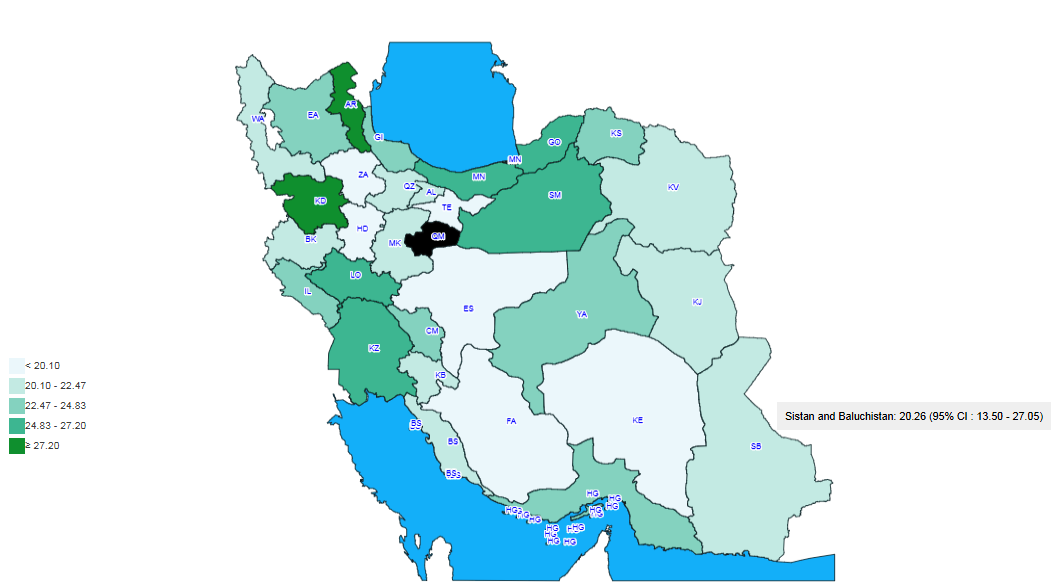
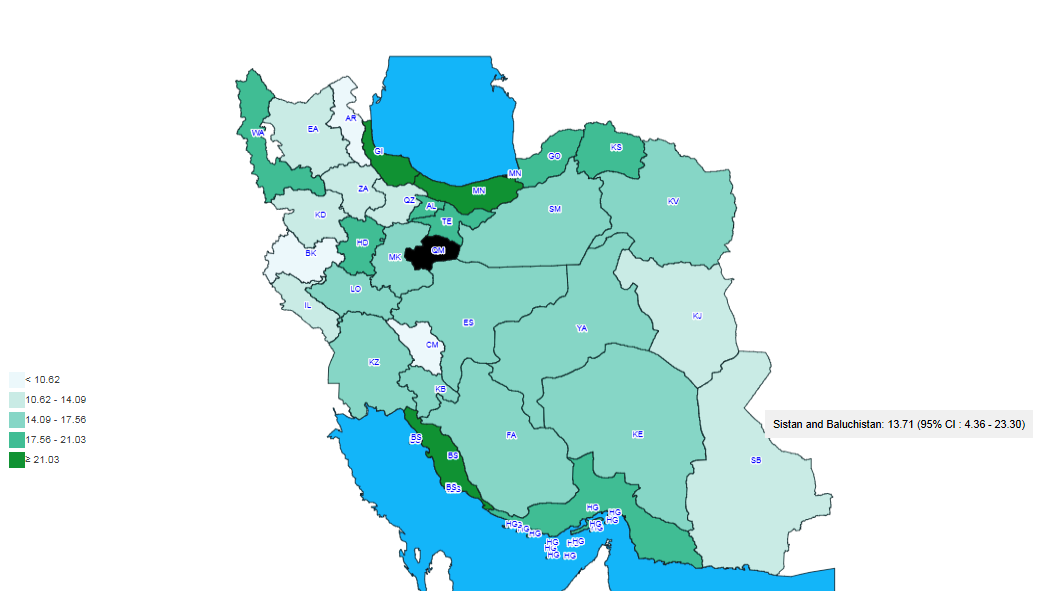
S3-Provincial distribution of appropriate fruit serving, age-standardized, both sexes, 2016
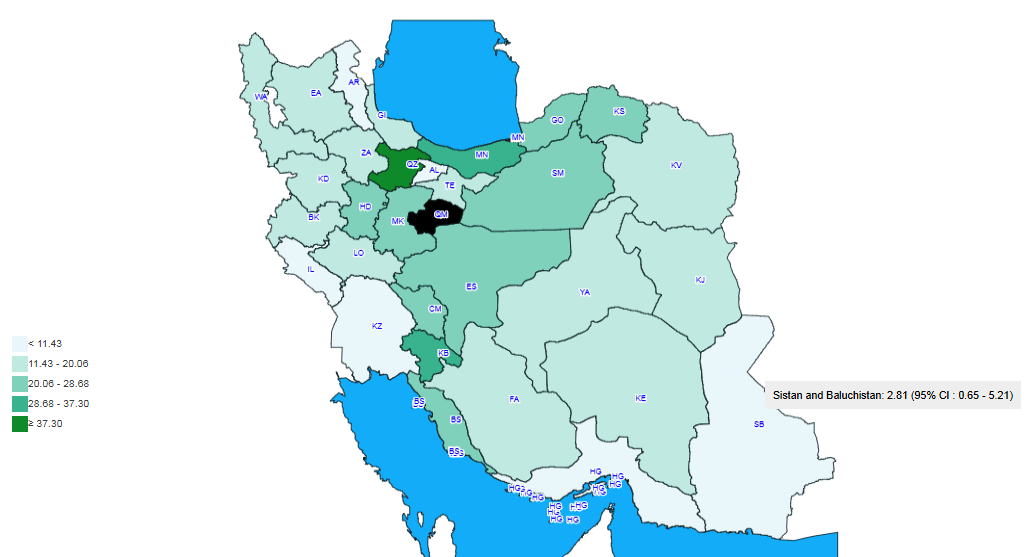
Source: https://vizit.report/en/index.html
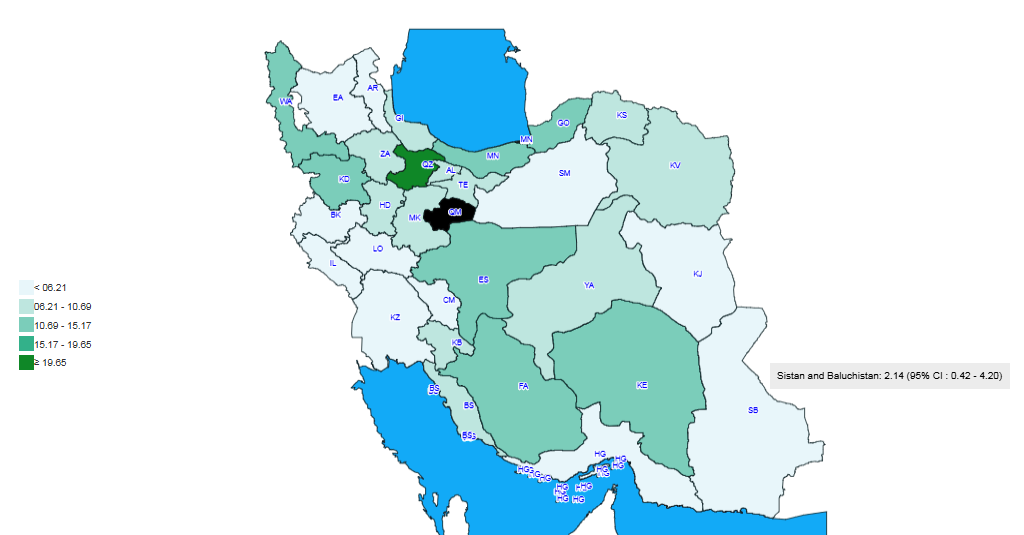
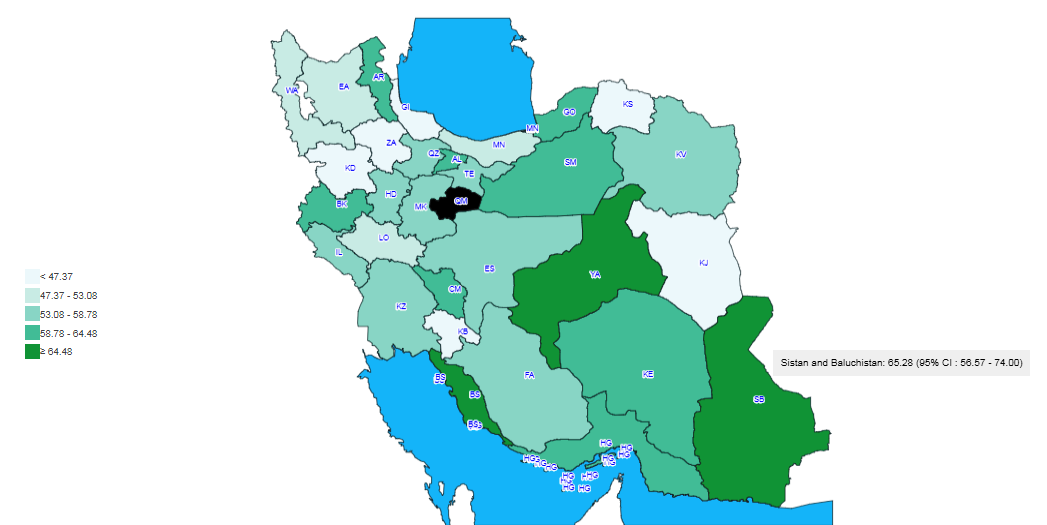
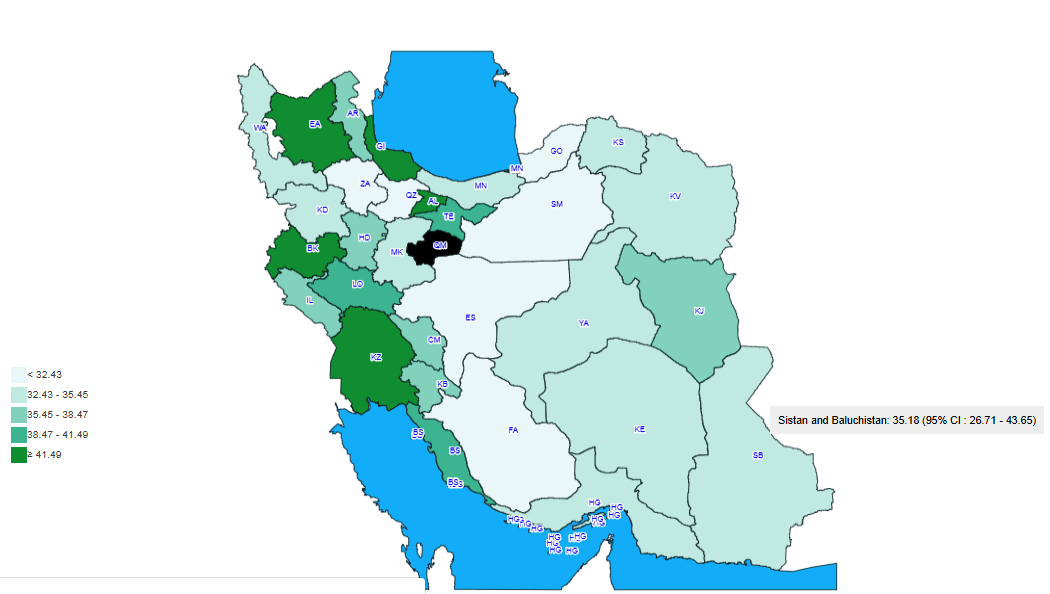
S4-Provincial distribution of appropriate salt intake, age-standardized, both sexes, 2016
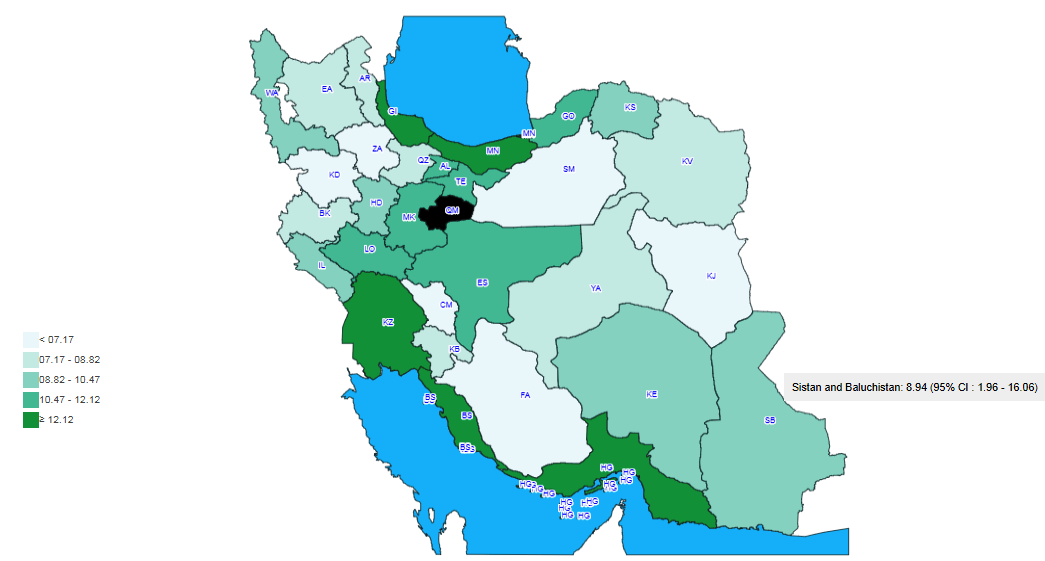
Source: https://vizit.report/en/index.html
S5-Provincial distribution of appropriate vegetable serving, age-standardized, both sexes, 2016
Source: https://vizit.report/en/index.html
S6-Provincial distribution of current daily cigarette smoke, age-standardized, both sexes, 2016
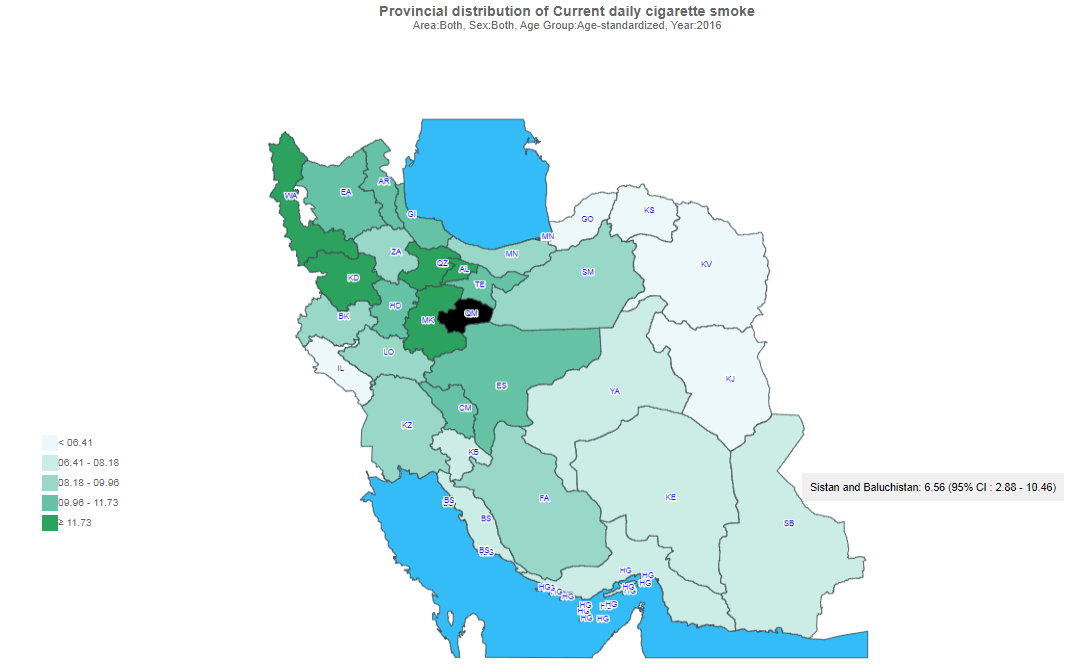
Source: https://vizit.report/en/index.html
S7-Provincial distribution of current tobacco smoke, age-standardized, both sexes, 2016
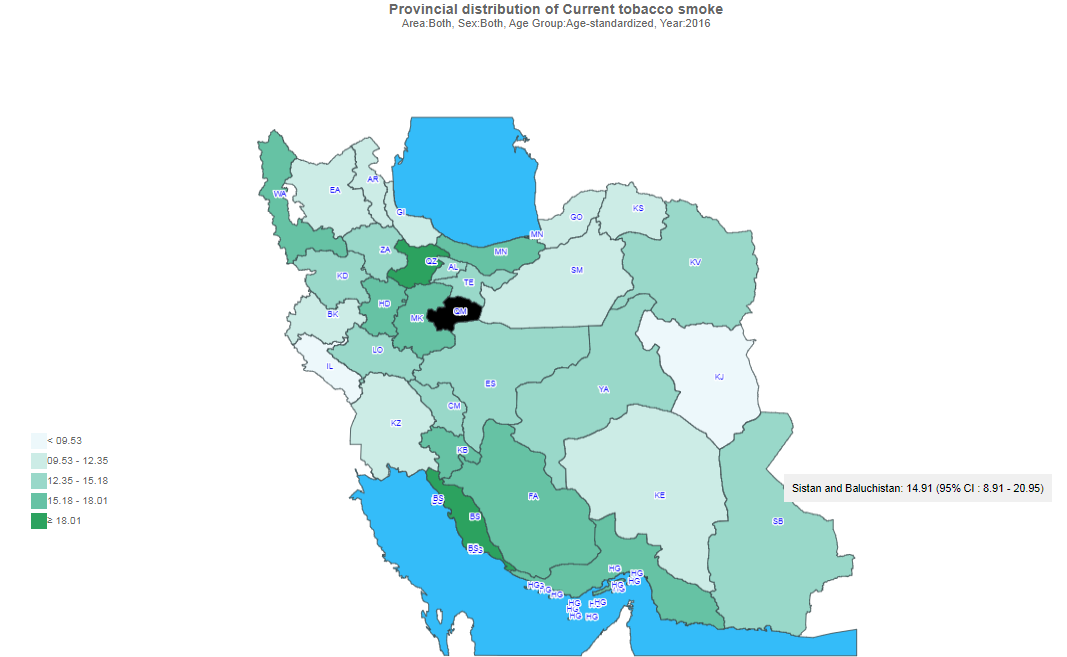
Source: https://vizit.report/en/index.html
S8-Provincial distribution of diabetes based on FPG, age-standardized, both sexes, 2016
Source: https://vizit.report/en/index.html
S9-Provincial distribution of been passenger of a drunk driver within the last year, age-standardized, both sexes, 2016
Source: https://vizit.report/en/index.html
S10-Provincial distribution of been drunk within the last year, age-standardized, both sexes, 2016
Source: https://vizit.report/en/index.html
S11- Provincial distribution of ever cigarette smoke, age-standardized, both sexes, 2016
Source: https://vizit.report/en/index.html
S12-Provincial distribution of ever drink alcohol, age-standardized, both sexes, 2016
Source: https://vizit.report/en/index.html
S13-Provincial distribution of ever tobacco smoke, age-standardized, both sexes, 2016
Source: https://vizit.report/en/index.html
S14-Provincial distribution of fast food consumption, age-standardized, both sexes, 2016
Source: https://vizit.report/en/index.html
S15-Provincial distribution of hypertension, age-standardized, both sexes, 2016
Source: https://vizit.report/en/index.html
S16-Provincial distribution of low physical activity (less than 600 METs), age-standardized, both sexes, 2016
Source: https://vizit.report/en/index.html
S17-Provincial distribution of Overweight, age-standardized, both sexes, 2016
Source: https://vizit.report/en/index.html
S18-Provincial distribution of Obesity, age-standardized, both sexes, 2016
Source: https://vizit.report/en/index.html
S19-Provincial distribution of pre-diabetes based on FPG, age-standardized, both sexes, 2016
Source: https://vizit.report/en/index.html
S20-Provincial distribution of Pre-hypertension, age-standardized, both sexes, 2016
Source: https://vizit.report/en/index.html
Figure A. The prevalence of poor physical activity among Iranian provinces

Source: Kazemi Karyani et al. BMC Public Health (2019) 19:1312
Beta Thalassemia Prevention Program
Figure 1- Prevalence of Beta Thalassemia gene by province
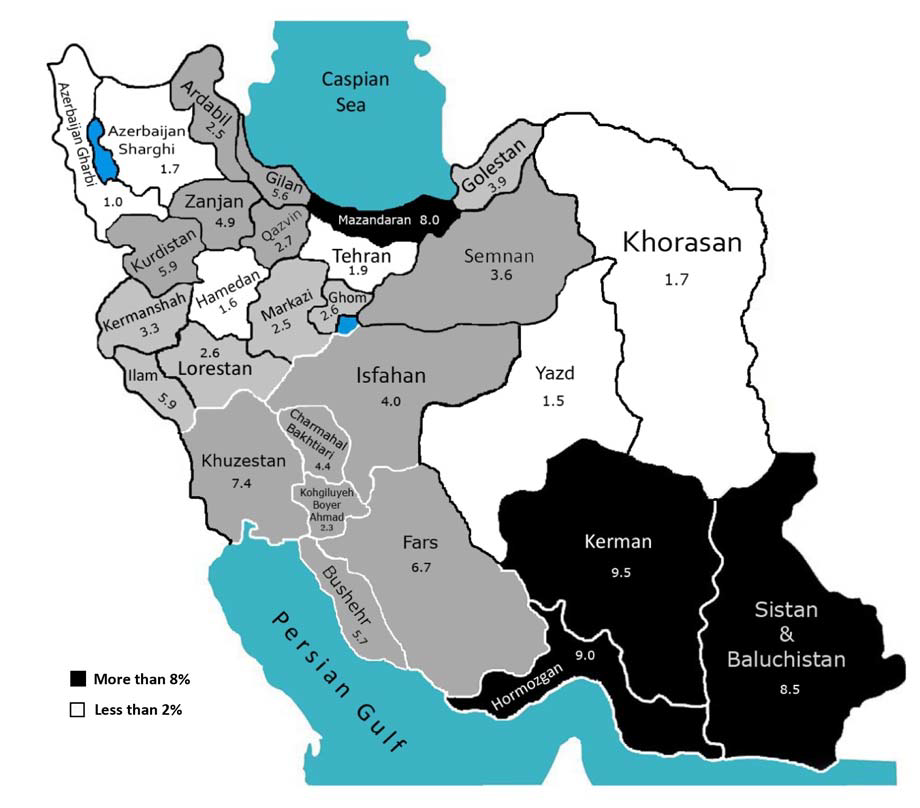
Source: Miri M, Tabrizi Namini M, Hadipour Dehshal M, Sadeghian Varnosfaderani F, Ahmadvand A, Yousefi Darestani S et al . Thalassemia in Iran in Last Twenty Years: the Carrier Rates and the Births Trend. IJBC. 2013; 6 (1) :11-17
URL: http://ijbc.ir/article-1-432-en.html
Figure 2- Distribution pattern of different mutations of β-Thalassemia in 21 provinces of Iran
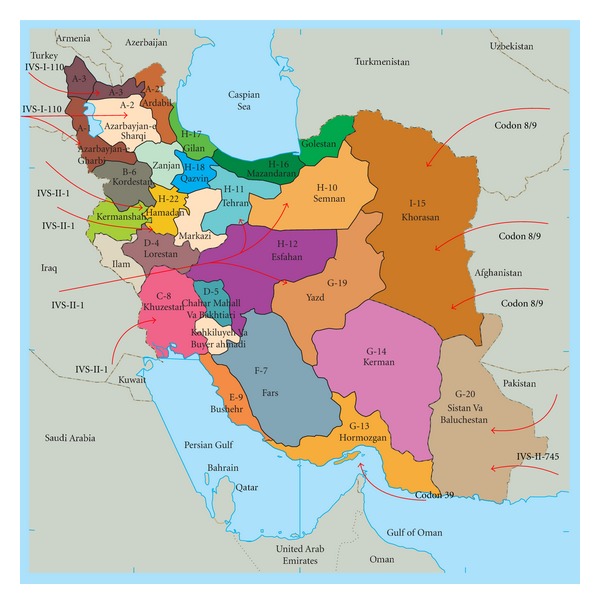
Source: ScientificWorldJournal. 2012;2012:635183. doi: 10.1100/2012/635183. Epub 2012 Dec 18.
Figure 3- Comparing the incidence of β-Thalassemia major ( per 10000 live births) between ZAUMS and country, 1997-2017
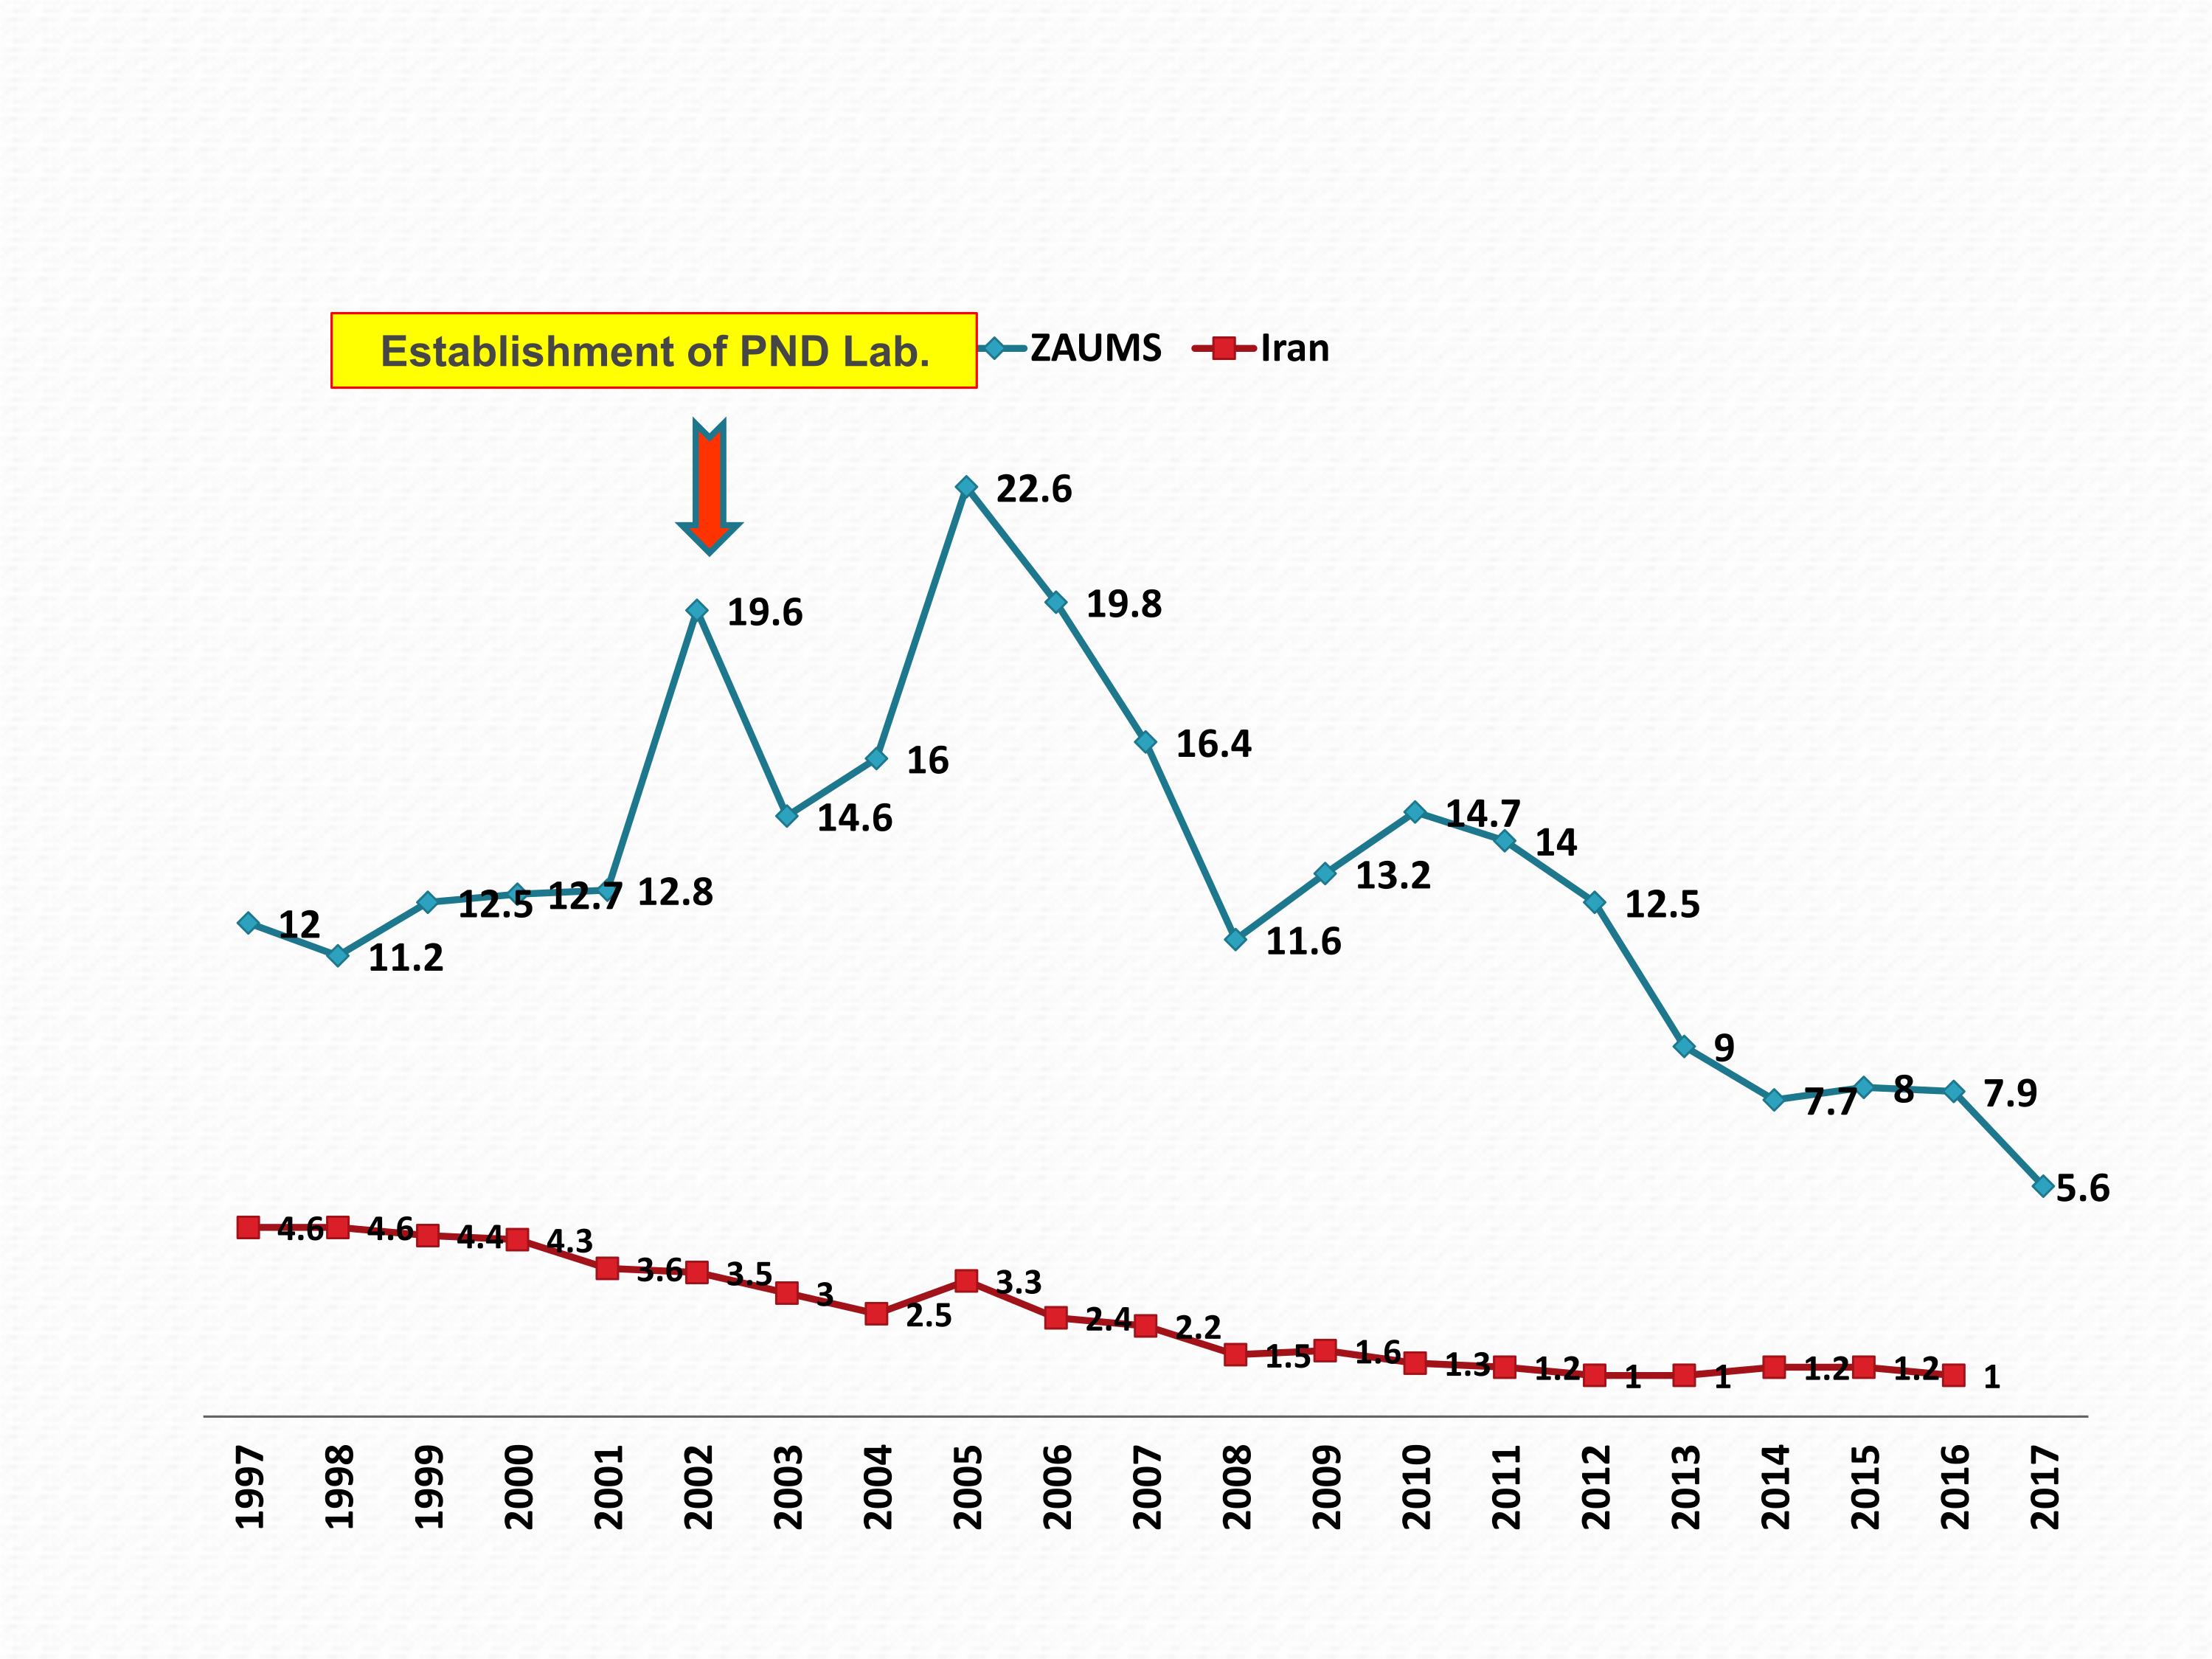
Figure 4 - The Zahedan University of Medical Sciences PND lab performance for diagnosis of pregnancies affected with β-Thalassemia major, 2002-2017
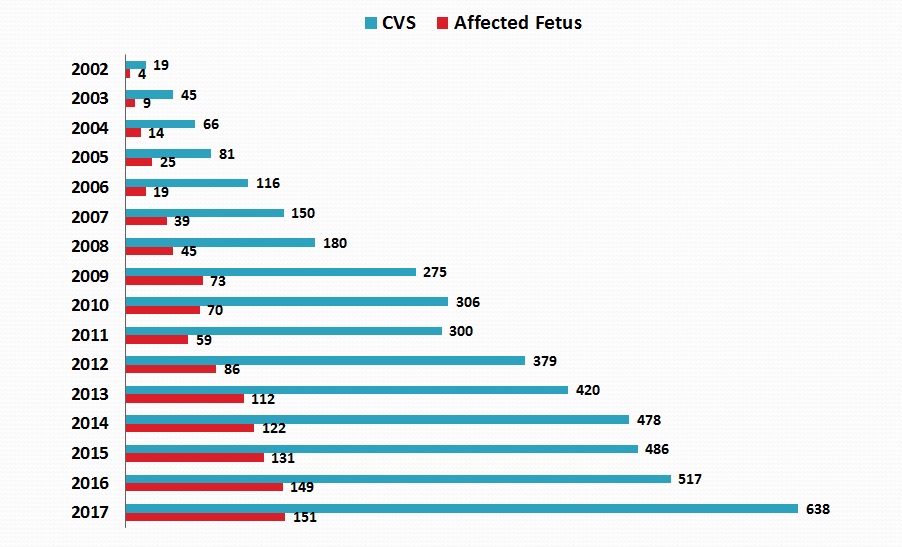
Figure 5- Kaplan-Meier survival estimates by (A) city and (B) different forms of thalassemia in selected provinces of Iran
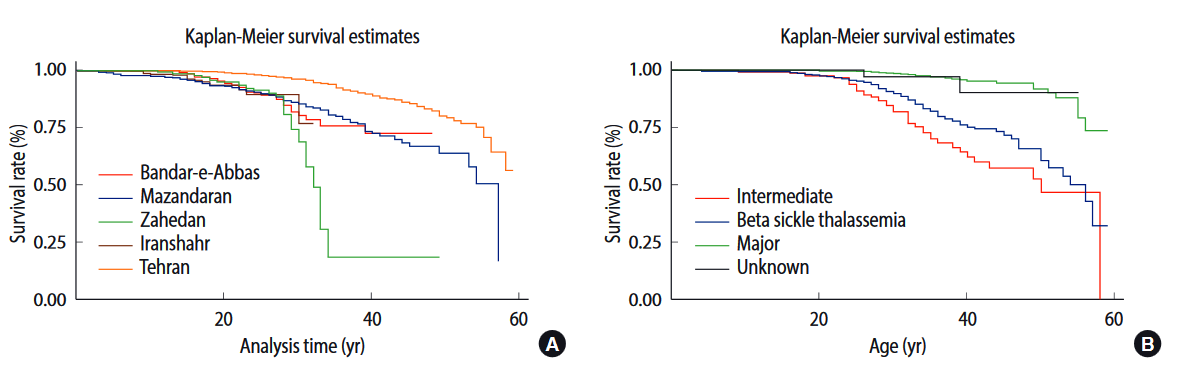
Source: Epidemiol Health. 2018;40:e2018048. doi: 10.4178/epih.e2018048. Epub 2018 Oct 3
Copyright © 2019 Zahedan University of Medical Sciences. All rights reserved. Date Updated: 09/09/2019.
Should you have any queries please do not hesitate to contact us on: zu.healthdeputy@gmail.com

The Narjes Infertility Treatment Center Received the Best Healthcare Leadership Awards at the IPH 2025 Congress, Tehran, Iran
Sep 14 2025

Renewal of the covenant of students, staff and faculty members of Zahedan University of Medical Sciences with the Holy Quran
Jul 30 2023

The UNICEF Country Office Health Team paid a Field Visit to Zahedan University of Medical Sciences on 25-26 July 2023, Zahedan-I.R. Iran
Jul 27 2023

NEW animated videos - An. stephensi, urban malaria, new types of ITNs released by Global Malaria Programme
Jul 20 2023


The Consul General of the Islamic Republic of Iran in Karachi and the Chief Minister of the Sindh Province in southern Pakistan agree to expand cooperation in the field of health and treatment affairs
Jul 17 2023

Another child in Zahedan, Southeast of Iran receives a cochlear implantation surgery to hear the world around her
Jul 11 2023

The first Internationalization Council of Zahedan University of Medical Sciences meeting for this year was held in June 2023
Jul 11 2023
WHO Webinar: The role of communities in case management and surveillance for cholera outbreaks
Jun 7 2023


Filter by :