Socio-demographic status of Sistan & Blouchestan Province
Socio-demographic status of Sistan & Blouchestan
Figure A.1: Human Development Index (HDI) across provinces in Iran, 2001 and 2009
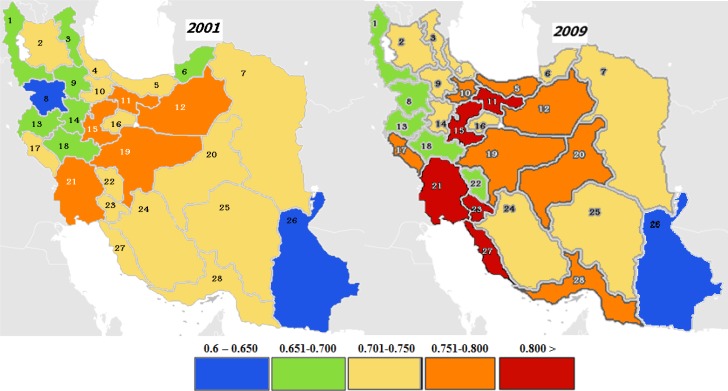
Source: Iran J Public Health. 2013; 42(2): 149-157.
Figure A.2: Changes in Sistan & Balouchestan Province population distribution by broad age groups,1957- 2017
![]()
Source: Statistical Center of Iran
Figure A.3: Life expectancy at birth in Iran by province, 2016
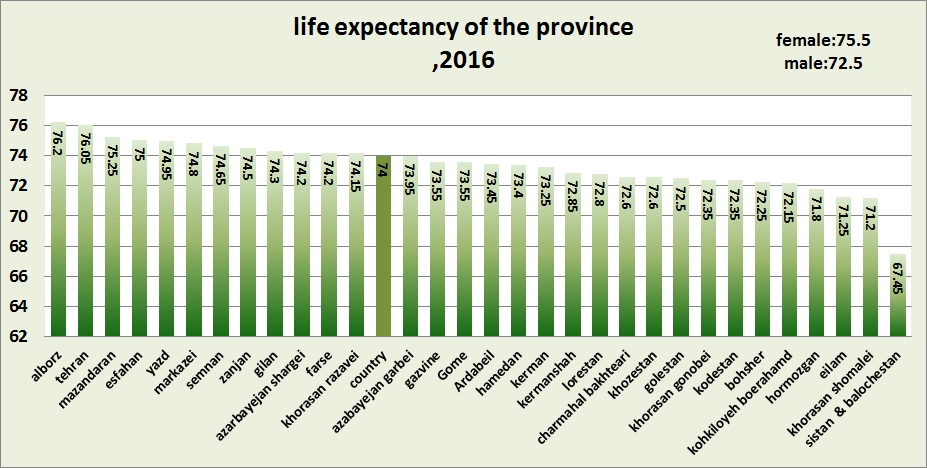
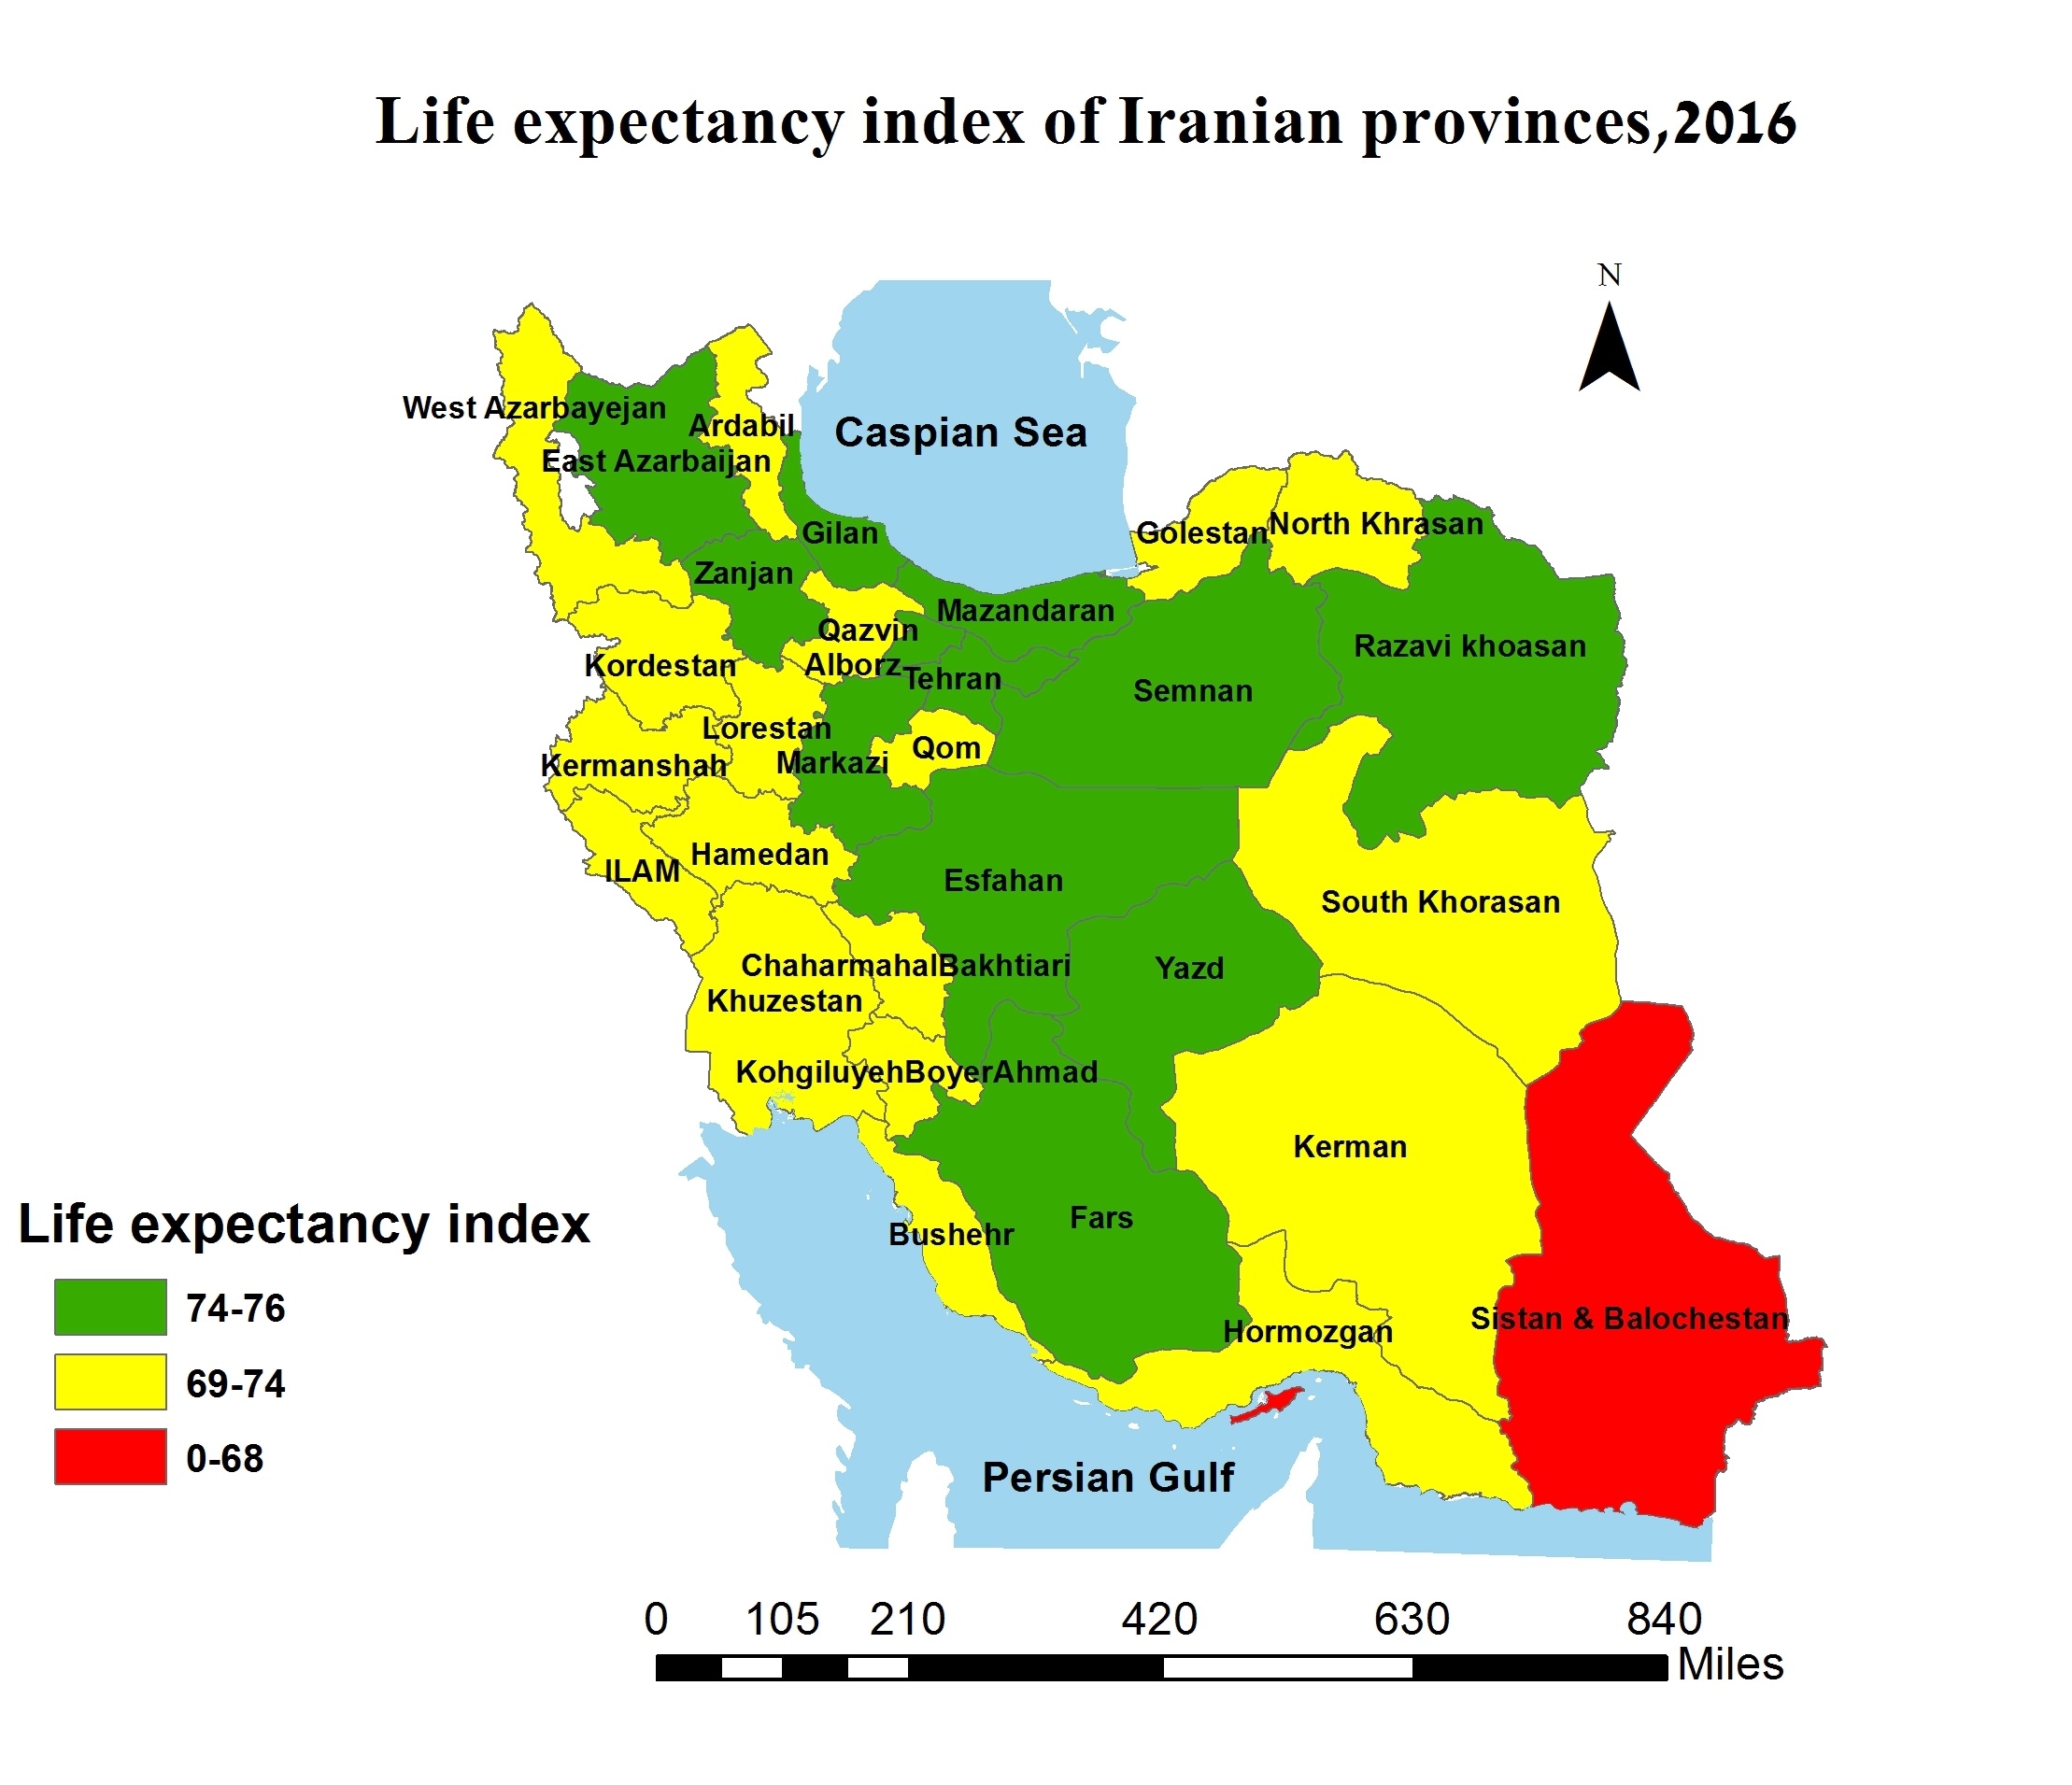
Figure A.4: The average annual population growth of Sistan & Blouchetsan Province as compared with average national rate, 1957-2017
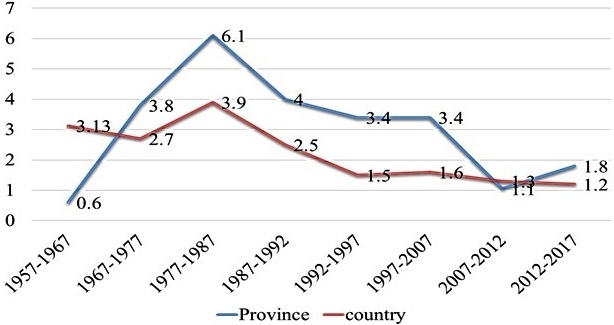
Figure A.5 :Total Fertility Rate (TFR) in Sistan & Balouchestan province as compared with national figures-1993-2017
Source: Statistical Center of Iran
Figure A.6: The average household size of Sistan and Baluchestan Province as compared with the average country figures, 1957-2017
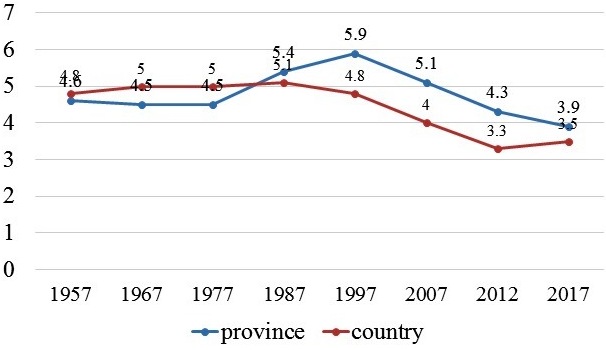
Figure A.7: The proportion of the urban and rural population in Sistan and Baluchestan Province and Iran,1957-2017
Source: Statistical Center of Iran
Figure A.8: Unemployment rate in Sistan and Baluchestan province in comparison with national average, 2006-2019
Figure A.9: Iran literacy rate by province, 2016
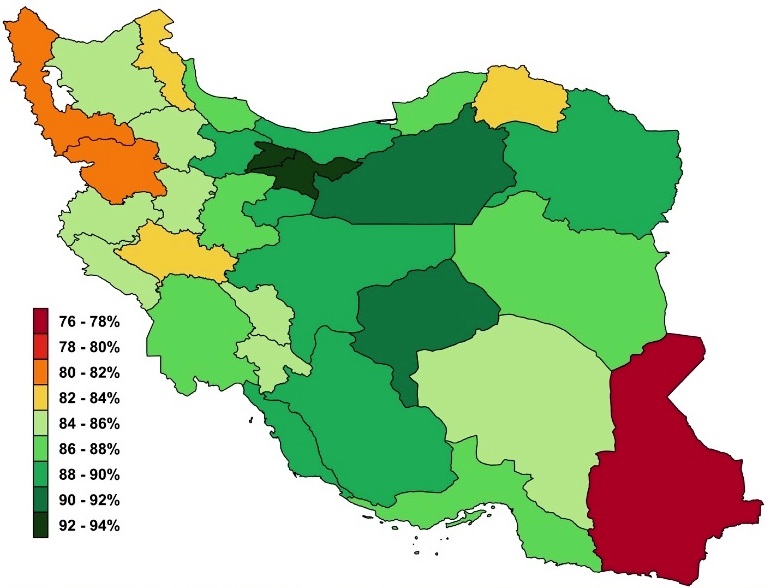
Source: Iran Population Dynamics and Demographic Window of Opportunity
Figure A.10: Comparison of literacy rates in Sistan and Baluchestan Province with the average national figures by gender, 1967-2017
Source: Statistical Center of Iran
Figure A.11: The proportion of the ZAUMS rural households with access to safe drinking water, 2001-2017
Figure A.12: The proportion of the ZAUMS rural population using basic sanitation services (WASH), 2001-2017
Copyright © 2019 Zahedan University of Medical Sciences. All rights reserved. Date Updated: 09/09/2019.
Should you have any queries please do not hesitate to contact us on: zu.healthdeputy@gmail.com

.jpeg)


comment